
Did you know that over 70% of retail traders lose money following unverified signal groups? You’re not alone if you’ve felt overwhelmed by the countless Telegram channels promising guaranteed profits!
Navigating the world of Telegram signal groups can feel like walking through a minefield. One wrong step, and your hard-earned money could vanish faster than you can say “moon rocket.” But here’s the thing – with the right analytical approach, you can separate the legitimate opportunities from the obvious scams.
I’ve spent years analyzing hundreds of signal groups, and I’m here to share everything you need to know. Whether you’re completely new to trading or just want to make smarter decisions about which groups to trust, this guide will give you the tools to analyze any Telegram signal group like a pro.
Understanding Telegram Signal Groups Fundamentals
Man, I wish someone had explained this stuff to me when I first stumbled into the world of Telegram signal groups three years ago. I was scrolling through crypto Twitter one night, probably way too late, when someone mentioned making “easy money” following trading signals. Within an hour, I was in like five different groups, completely clueless about what I was getting myself into.
What are Telegram signal groups and how they operate
Telegram signal groups are basically chat rooms where someone (or a team) shares trading recommendations with subscribers. Think of it like getting stock tips from your uncle at Thanksgiving dinner, except it’s happening 24/7 and involves way more emojis and rocket ship symbols.
The person running the show – usually called the “signal provider” or “admin” – will post messages telling you when to buy or sell specific assets. They’ll include entry points, stop losses, and take profit levels. Sounds simple enough, right? That’s what I thought too.
Most groups work on a broadcast model where the admin posts signals and thousands of members receive them simultaneously. Some fancier operations use bots that automatically format the signals or even connect to trading platforms. I remember being impressed by one group that had this slick bot posting charts and analysis – turned out the fancy presentation didn’t make the signals any better.
Different types of signal groups (free vs premium, forex vs crypto vs stocks)

Here’s where things get interesting. Most groups operate on a freemium model that would make mobile game developers proud. You’ll find free groups everywhere – just search “forex signals” or “crypto signals” in Telegram and you’ll get hundreds of results.
But here’s the catch I learned the hard way: free groups are usually just marketing funnels. They’ll give you maybe one decent signal a week, then constantly push their premium services. I remember getting frustrated because the free signals would come with vague instructions like “BUY EURUSD” with no clear exit strategy.
Premium groups, which can cost anywhere from $50 to $500+ monthly, promise better accuracy rates and more detailed analysis. Some even claim 80-90% win rates, which should immediately make your BS detector go off. After trying three different premium services and losing about $800 in subscription fees alone, I realized that higher prices don’t necessarily mean better results.
Forex signal groups tend to focus on major currency pairs like EUR/USD, GBP/USD, and USD/JPY. These usually provide more traditional technical analysis and have somewhat reasonable risk management practices.
Crypto signal groups are where things get wild. They’re often pushing altcoins with names you can’t pronounce, promising 100x returns. I got caught up in one that was constantly shilling obscure DeFi tokens. Spoiler alert: most of them crashed hard.
Stock signal groups usually focus on day trading opportunities or swing trades. They’re generally more regulated in their language but can still oversell their success rates.
Common terminologies and signal formats you’ll encounter
Every group has its own terminology that makes newcomers feel like they’re reading a foreign language. “Long” means buy, “short” means sell. “SL” is stop loss, “TP” is take profit. When someone says “BTFD,” they mean “buy the dip” – though whether that’s good advice depends entirely on the situation.
You’ll also see accuracy percentages thrown around constantly. “Our last 10 signals hit 90% accuracy!” But here’s what they don’t mention – they might count partially successful trades as wins, or only count the signals that actually got filled.
A typical signal format looks something like this: “EURUSD LONG Entry: 1.0850-1.0870 SL: 1.0820 TP1: 1.0920 TP2: 1.0950.” The more detailed ones include risk-reward ratios and position sizing recommendations, which are actually pretty helpful if you’re trying to manage your account properly.
The psychology behind signal group marketing tactics
Signal group admins are masters of psychological manipulation, whether they realize it or not. They create FOMO (fear of missing out) by posting screenshots of huge wins, use urgency tactics like “ONLY 5 SPOTS LEFT,” and build false intimacy by sharing personal stories about their trading journey.
I fell for this hard with one group that constantly posted Lamborghini photos and talked about “changing lives.” The admin would share voice messages about his breakfast routine and make everything feel super personal. It took me months to realize I was basically paying for entertainment, not profitable trading advice.
They also use social proof heavily – posting testimonials and member counts to make you feel like you’re missing out on some exclusive club. One group I was in would regularly post fake conversations with “satisfied customers” that were obviously scripted.
Essential Metrics for Analyzing Signal Group Performance
I used to be one of those people who’d join a crypto futures signal group, follow a few trades, and then either celebrate or rage quit based on whether I made money that week. Terrible approach, I know. It wasn’t until I blew through about $3,500 following leverage signals blindly on Binance that I realized I needed to actually track performance data like a grown-up. Turns out, the flashy win rate percentages these groups advertise tell maybe 10% of the real story when you’re dealing with 10x-50x leverage.
How to track win rates and calculate actual profitability
Here’s something that’ll blow your mind – a crypto futures signal group can have an 85% win rate and still blow your account. I learned this the expensive way with a group that bragged about their “95% accuracy on BTC signals.” They were technically right about winning most trades, but their losing trades were liquidation events that wiped out weeks of gains in minutes.
Real win rate calculation for futures isn’t just counting green vs red trades. You need to track what percentage of signals actually got filled at the entry price they posted, especially during volatile crypto market hours. I started keeping a spreadsheet with columns for signal time, entry price achieved, exit price, liquidation hits, and whether I could even get in at their recommended level during fast-moving markets.
One group I tracked for four months posted 89 BTC futures signals with a claimed 82% win rate. But when I factored in slippage during high volatility periods and the signals I couldn’t fill due to exchange overloads, my actual win rate was closer to 68%. And that’s before considering the three trades that hit my liquidation price instead of their stop loss.
For profitability calculation with futures, forget about percentage gains on individual trades. Track your actual USDT P&L relative to your margin balance. A 15% winner on ETH/USDT means nothing if you got liquidated on the next trade because of poor position sizing. I use this formula: (Ending Margin Balance – Starting Margin Balance) / Starting Margin Balance × 100 = Actual Return.
The most eye-opening thing? Start tracking when signals get posted versus crypto market volatility periods. You’d be surprised how many “profitable” signals get posted right before major resistance levels or during low-volume Sunday sessions when one whale can trigger mass liquidations.
Understanding risk-to-reward ratios in signal analysis
This metric literally saved me from getting rekt multiple times. Risk-to-reward ratio in crypto futures is how much you stand to make versus how much you’re risking before liquidation. If a signal has a 2% stop loss and a 6% target on 10x leverage, that’s theoretically a 1:3 risk-reward ratio.
Most decent crypto futures groups should maintain at least a 1:2 ratio on average, but here’s where it gets tricky with leverage. I tracked one altcoin futures group for two months that claimed 1:4 ratios on their calls. Reality check: they were measuring from entry to their most optimistic target while using 25x leverage, ignoring that 80% of trades never reached the second take profit before getting stopped out by volatility.
What really matters is the average risk-reward of your actual closed trades, not what they promise in their marketing. I calculate this weekly: Total Profits ÷ Total Losses = Actual R:R. With crypto futures, if this number is below 2.0, you need a win rate above 70% just to survive the inevitable liquidation events and funding fees.
Here’s a brutal truth – many crypto signal groups use tight stop losses (like 1-2%) with high leverage to inflate their win rates, then wonder why members get liquidated during normal crypto volatility. Always check if their stop loss recommendations make sense relative to the asset’s average daily range and recent volatility spikes.
Analyzing drawdown periods and recovery patterns
Drawdown tracking in crypto futures is literally life or death for your account. It measures how much your margin balance drops from its peak before recovering. Every signal group goes through rough patches, but the good ones recover systematically rather than revenge trading with 50x leverage after losses.
I track maximum drawdown and drawdown duration specifically for crypto markets. One futures group I followed had beautiful performance during the May 2023 alt season, but buried in that data was a 45% drawdown during a single week when Terra Luna collapsed and took the whole market down. That’s the kind of psychological torture that’ll make you quit crypto altogether.
Recovery patterns in crypto are different from traditional markets because of the extreme volatility. Good signal providers gradually work their way back to profitability with consistent position sizing and proper leverage management. Red flag providers typically try to “make it all back” with 100x YOLO trades on meme coins after major drawdowns.
I use a stricter rule for crypto futures: if a signal group’s maximum drawdown exceeds 30% of starting balance, or if recovery takes longer than six weeks, I’m out. Crypto moves too fast to ride extended drawdowns like you might in forex.
The scariest thing I learned? Some groups hide their true drawdowns by only showing closed trade P&L, not accounting for open positions that went massively underwater before eventually closing green. Always track your real-time account balance, not just closed trade results.
Measuring consistency over different market conditions
This is where most crypto signal groups completely fall apart. They’ll perform amazing during bull runs with 20x leverage on everything, then implode spectacularly when the market shifts to crab mode or bear territory. I watched one group crush it during the 2021 DeFi summer, then lose 80% of member accounts during the subsequent crypto winter.
Track performance across different crypto market phases: bull runs, bear markets, sideways crab action, and extreme volatility events like exchange hacks or regulatory news. Use metrics like weekly return standard deviation because crypto moves way faster than traditional markets.
Market structure matters hugely in crypto futures. Some strategies work great during Asian trading hours when volume is lower, but get absolutely destroyed during US market overlaps when institutional players enter. I track this by breaking down performance by time of day and correlating with major exchange volume patterns.
The best crypto signal providers I’ve found maintain positive expectancy across multiple market conditions, even if they reduce leverage during uncertain periods. Consistency beats moon shots when it comes to not getting liquidated.
Setting up automated tracking with SignalManager for accurate data collection
Manual tracking of crypto futures gets insane fast, especially when you’re following multiple altcoin signals across different exchanges. After two months of updating spreadsheets while trying to catch entries during 3am pump and dumps, I started looking for automated solutions. That’s when I discovered SignalManager.
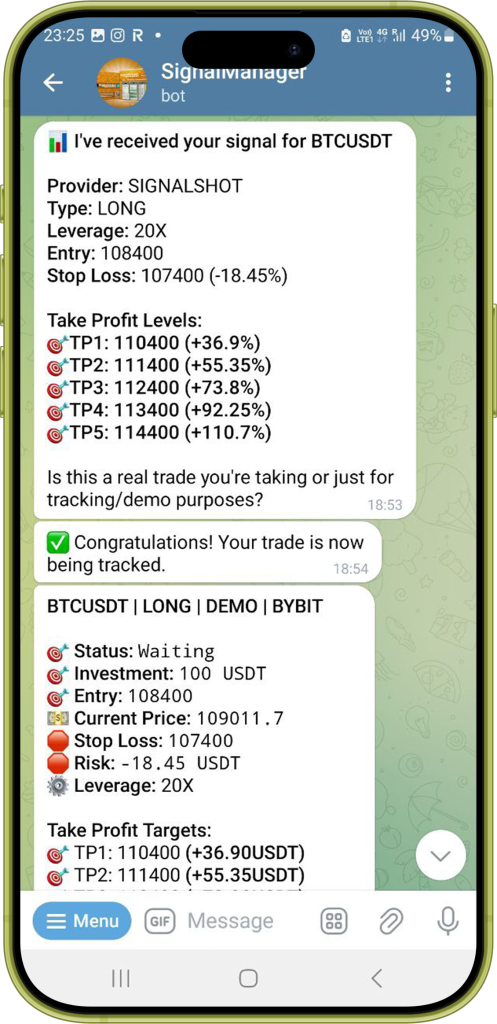
SignalManager changed everything for me. Instead of frantically copying and pasting signals into spreadsheets, I just forward any signal from my Telegram groups directly to SignalManager and it automatically parses everything. The system recognizes most common signal formats immediately, and if it encounters a new format, it gets added to their database pretty quickly.
What I love is that it doesn’t require me to give access to my Telegram groups or add any sketchy bots. I maintain complete control over which signals to track while keeping my group memberships private. Some partner groups even have a direct “Forward to SignalManager” button, which makes it even smoother.
The real game-changer is how it tracks performance using real-time market data from exchanges like Bybit without needing my API keys. I get instant notifications when targets are hit, and the analytics help me identify which signal providers are actually profitable versus just good at marketing.
I started with their free tier that tracks up to 3 signals, which was perfect for testing it out. The $15/month subscription unlocks tracking for up to 6 signals, and if you go annual, you get 20% off plus unlimited signal tracking. Honestly, it pays for itself by helping me avoid just one bad signal provider.
The performance analytics revealed patterns I never would have caught manually. Like how one group I was following had great win rates during Asian hours but terrible performance during US trading sessions. That kind of insight is worth way more than the subscription cost.
Bottom line: if you’re serious about following crypto futures signals and not getting rekt, you need systematic tracking. SignalManager makes it actually possible to analyze signal performance properly without spending hours on spreadsheets or missing crucial market movements while you’re updating data.
Red Flags That Deserve Extra Research Before Joining

I’ve been tracking crypto signal groups for over two years now, and I’ve learned that due diligence is everything in this space. While there are some genuinely skilled signal providers out there, the industry also attracts operators who might not have your best interests at heart. The good news? With proper research and tracking tools, you can separate the wheat from the chaff pretty effectively.
Overly optimistic profit claims that need verification
When I see groups advertising “300% monthly returns guaranteed” or “turn $100 into $10,000 in 30 days,” my first instinct isn’t to run away – it’s to dig deeper. These bold claims might be based on cherry-picked results from their best performing period, or they could reflect legitimate short-term success during favorable market conditions.
The key is verification. I’ve found that groups making ambitious profit claims sometimes do have periods of exceptional performance, but they often don’t mention the corresponding drawdown periods or risk levels involved. One group I tracked actually did achieve 280% returns over six weeks during an altcoin bull run, but they also had a 45% drawdown the following month.
This is where independent tracking becomes invaluable. Instead of taking profit claims at face value, you can monitor their signals and track actual performance over time. Real market data shows you exactly what returns are achievable when you factor in slippage, timing, and market conditions.
The most reliable approach is to look for groups that discuss risk management alongside profit potential. Providers who mention position sizing, maximum drawdown limits, and market condition adjustments tend to have more sustainable approaches than those focused purely on headline-grabbing return percentages.
Limited trading history transparency worth investigating
Some signal groups are hesitant to share complete trading histories, which could indicate they’re newer operators still building their track record, or they might be selectively showing only their best results. Either way, it’s worth investigating further before committing significant capital.
I’ve encountered groups that only show recent results or provide custom-made performance reports instead of actual exchange statements. While this isn’t necessarily a deal-breaker, it does mean you’ll want to track their performance yourself for a meaningful period before increasing your position sizes.
The beauty of modern tracking is that you can create your own transparency. By monitoring signals and their outcomes over time, you’re building an independent record that can’t be manipulated. After tracking one group for three months, I discovered their actual win rate was about 12% lower than advertised, but their risk management was solid enough to still be profitable.
Some groups are protective of their detailed strategies for competitive reasons, which is understandable. The important thing is being able to verify that their posted signals actually match market opportunities and that their performance claims align with trackable results.
High-pressure marketing tactics that warrant caution
Urgency-based messaging like “only 3 spots left” or “price doubles tomorrow” is pretty common in the signal group space. While some of these offers might be legitimate limited-time promotions, they’re worth approaching with a measured mindset rather than making impulsive decisions.
I’ve noticed that the most successful long-term signal providers tend to focus on education and building trust rather than creating artificial scarcity. They’re usually happy to let you start with their free signals or basic tiers to evaluate their approach before upgrading.
The groups that have performed best in my experience were patient with questions and didn’t pressure me to upgrade immediately. They understood that smart traders want to verify performance before increasing their investment in any signal service.
If you encounter high-pressure tactics, consider taking time to evaluate their free or lower-tier signals first. This cooling-off period lets you assess their approach objectively before making larger commitments.
Complex fee structures worth understanding upfront
Some signal groups have evolved beyond simple monthly subscriptions to offer multiple tiers, add-on services, and premium features. While this isn’t inherently problematic, it’s important to understand the complete fee structure before getting started.
I’ve encountered groups with base subscriptions that include basic signals, but additional fees for things like detailed analysis, one-on-one coaching, or access to higher-risk/higher-reward calls. This tiered approach can actually be beneficial if it lets you start small and scale up based on results.
The key is transparency. Legitimate providers should be upfront about all available services and their associated costs. If pricing information is vague or only revealed after you’ve already subscribed, that’s worth questioning.
Consider starting with the most basic offering available and scaling up only after you’ve verified performance through your own tracking. This approach protects you from overcommitting to services before you understand their actual value.
The Bottom Line on Research
Rather than avoiding groups that exhibit these characteristics entirely, use them as signals to do additional research. This is where SignalManager’s approach really shines – you can track any signal group’s performance with real market data before risking significant capital.
The platform’s demo mode lets you forward signals and analyze their actual performance using live market conditions without committing real money. You can track win rates, measure risk-reward ratios, and see how groups perform during different market conditions – all the metrics we discussed earlier in this guide.
I wish I’d had access to this kind of objective performance tracking when I started following signal groups. Instead of relying on marketing claims or gut feelings, you can build a data-driven evaluation of any signal provider. After tracking several groups for a few weeks each, the patterns become clear pretty quickly.
The signal groups that have contributed positively to my trading over the long term were the ones that held up under systematic analysis. Some initially seemed “too good to be true” but proved their worth through consistent performance across multiple market conditions.
Your best protection isn’t avoiding signal groups entirely – it’s developing the tools and habits to evaluate them objectively using real performance data before scaling your involvement.
Step-by-Step Analysis Framework
After burning through thousands of dollars following signals without any systematic approach, I finally got smart and developed a proper framework for evaluating crypto signal groups. This isn’t rocket science, but it does require patience and discipline – two things I definitely didn’t have when I started. The framework I’m about to share took me almost eight months to perfect, but it’s saved me from countless bad decisions and helped me identify the few signal providers actually worth following.
Creating your evaluation checklist for systematic analysis
The biggest mistake I made early on was analyzing signal groups based on gut feelings and recent performance. One week a group would hit three big winners and I’d think they were geniuses, then the next week they’d have a rough patch and I’d rage quit. Building a proper checklist forced me to look at the data objectively instead of making emotional decisions.
My evaluation checklist starts with basic operational factors: Does the group post signals during liquid market hours? Do they provide clear entry ranges, stop losses, and take profit levels? Are their position sizing recommendations reasonable for the leverage they suggest? These seem obvious, but you’d be surprised how many groups fail these basic criteria.
Next, I look at risk management practices. Does the group discuss maximum daily losses? Do they adjust position sizes based on market volatility? When they hit stop losses, do they explain what went wrong or just move on to the next signal? The best groups I’ve tracked treat losses as learning opportunities rather than brushing them under the rug.
Communication quality is another huge factor. Are signals posted with enough detail to execute properly? Do they provide market context or just raw entry/exit levels? Groups that explain their reasoning tend to help you develop better trading instincts, while those that just post “BUY ETH 1850” without context are basically just gambling tips.
I also track community engagement metrics. How many members actually participate in discussions? Do people share both wins and losses, or only celebrate the good trades? Healthy signal communities have active dialogue about market conditions and risk management, not just emoji celebrations when trades go green.
How to conduct a 30-day trial analysis period
Thirty days gives you enough data to see how a signal group performs across different market conditions without committing huge amounts of time or money. I learned this timeframe the hard way after spending six months tracking one group that had an amazing first two weeks, then completely fell apart during a volatile period.
During the trial period, I track every single signal they post, whether I can execute it or not. This includes signals posted during hours when I’m sleeping or when markets are moving too fast to get clean fills. The goal is understanding their complete signal output, not just the ones that are convenient for me to follow.
I break the 30-day period into weekly segments to identify patterns. Some groups perform great during trending market weeks but struggle when crypto goes sideways. Others excel during high-volatility periods but underperform in calm markets. You need to see how they handle different conditions before making long-term commitments.
Documentation during this period is crucial. I track signal timing, market conditions when posted, actual fill prices versus recommended entries, and whether their stop losses and take profits are realistic given market volatility. One group I analyzed had beautiful theoretical returns, but their signals consistently got posted right before major resistance levels where fills were nearly impossible.
I also pay attention to their behavior during losing streaks. Do they adjust their approach or double down with higher leverage? The best signal providers I’ve found acknowledge rough patches and sometimes reduce position sizes or take breaks during uncertain market periods.
Documentation methods for tracking signals accurately
Excel spreadsheets work fine for basic tracking, but I’ve found that dedicated tracking methods give you much better insights. The key is capturing not just whether trades won or lost, but all the context around each signal that affects real-world execution.
For each signal, I document the posting time, market conditions, recommended entry price, actual entry price achieved, exit method (stop loss, take profit, or manual), and time to completion. This granular data reveals patterns that simple win/loss ratios miss completely.
Market context documentation has been game-changing for my analysis. I note whether signals were posted during major news events, funding rate periods, or unusual volatility. Some groups that look mediocre overall actually perform quite well during specific market conditions, which is valuable information for selective following.
I also track my own execution challenges. Did I miss the entry due to timing? Was the stop loss too tight for normal market fluctuations? Were there any technical issues with my exchange during the trade? This helps separate signal quality from execution problems.
The most eye-opening metric I started tracking was “signal aging” – how performance changes based on how quickly you can act on signals. Some groups’ signals work great if you execute within 5 minutes but deteriorate rapidly after that, while others remain valid for hours.
Using forwarding methods to track signals in real-time
Real-time tracking changed everything for my signal analysis. Instead of manually copying signals into spreadsheets hours later, forwarding methods let you capture exact timing and market conditions when signals are posted. This eliminates the human error and memory gaps that plagued my early tracking efforts.
The forwarding approach I use captures signals immediately when they’re posted, along with real-time market data. This means you can see exactly what price levels were available when the signal went out versus what you might have achieved if you acted hours later. The timing differences in crypto can be massive.
What’s particularly valuable is tracking signals you can’t personally execute due to timing or other constraints. Maybe a group posts a signal at 3am your time, or during a period when you’re away from your computer. Forwarding methods still capture these signals and their outcomes, giving you a complete picture of the group’s performance.
I’ve discovered that some signal groups actually have their best performance during inconvenient hours for my timezone. Without comprehensive tracking, I might have dismissed these groups based only on the signals I could personally execute during my active hours.
The real-time aspect also helps with understanding market impact. You can see if signals consistently get posted right before major moves or if they’re reacting to price action rather than predicting it. This distinction matters a lot for determining whether a group has genuine analytical edge or just good timing.
Making data-driven decisions about subscription renewals
After 30 days of systematic tracking, the renewal decision becomes much clearer. I use a scoring system based on multiple metrics rather than just profitability, because a group might be profitable during one market cycle but unsustainable long-term.
My primary metrics are risk-adjusted returns, maximum drawdown, signal execution difficulty, and consistency across different market conditions. A group that makes 20% monthly returns but has 40% drawdowns isn’t sustainable for most traders’ psychology, even if the math works out.
I also factor in educational value and communication quality. Groups that help you understand market dynamics are worth more than those that just provide raw signals. The knowledge transfer can make you a better trader independent of their signals.
The renewal decision isn’t just about whether to continue or cancel – it’s also about how much capital to allocate. Maybe a group performs well enough to follow with 2% position sizes but not 5%. Or perhaps they excel during specific market conditions, so you only follow them selectively.
I’ve found that the most successful approach is building a portfolio of signal sources rather than going all-in on any single group. After systematic analysis, you might discover that one group is great for trending markets, another excels during high volatility, and a third provides solid risk management during uncertain periods.
The framework takes discipline to implement consistently, but it’s transformed my approach from gambling to systematic evaluation. Most importantly, it’s helped me avoid the emotional decisions that cost me so much money during my early signal-following days.
Essential Tools for Signal Group Analysis
I spent my first year tracking signal groups with basic spreadsheets and sticky notes, thinking I was being thorough. What a nightmare that was. Between trying to manually update data while monitoring multiple exchanges and missing crucial signals because I was asleep, I realized pretty quickly that proper tools weren’t just convenient – they were absolutely necessary for any serious signal analysis.
Free tracking options vs professional signal management platforms
When I started out, free options seemed like the obvious choice. Why pay for tracking when you can just use Google Sheets, right? I set up elaborate spreadsheets with columns for entry prices, exit prices, win rates, and profit calculations. It worked okay for tracking one or two groups, but as soon as I tried analyzing multiple signal providers simultaneously, the manual workload became ridiculous.
Free tracking has some real limitations that aren’t obvious at first. You’re constantly behind real-time market movements because you’re manually entering data. I missed capturing several flash crashes and pump events that significantly affected signal outcomes simply because I couldn’t update my spreadsheets fast enough.
The bigger issue with manual tracking is consistency. Some days I’d be super diligent about logging every detail, other days I’d forget to update anything until hours later. After a few weeks, my data was full of gaps and inconsistencies that made meaningful analysis nearly impossible.
This is actually when I first discovered Cornix, which was a huge step up from manual spreadsheets. Cornix offered automated trade execution and basic performance tracking, which solved my timing problems and gave me better data consistency. I used it for about eight months and it definitely improved my signal following experience.
But here’s what I learned about Cornix: while it’s excellent for execution and basic tracking, it’s not really designed for comprehensive signal group analysis. You can see your trade results and basic metrics, but comparing multiple signal providers, analyzing performance across different market conditions, or tracking signals you don’t actually execute – that’s where it falls short.
Professional platforms solve these problems by automating data collection and maintaining consistent standards. They connect directly to exchange APIs to pull real-time price data, so you’re not guessing about market conditions when signals were posted. The time savings alone made them worthwhile for me.
How SignalManager simplifies signal tracking across multiple groups
After using Cornix for execution, I realized I needed something specifically designed for signal analysis rather than just trade automation. That’s when I discovered SignalManager, and it completely changed my approach to analyzing multiple signal groups.
While Cornix was great for executing signals I’d already decided to follow, SignalManager excels at helping me decide which signals are worth following in the first place. Instead of juggling separate spreadsheets for each group and trying to correlate performance data manually, everything gets centralized in one place with automated processing.
The forwarding system makes data collection effortless. I just forward signals from any Telegram group directly to SignalManager, and it automatically parses the signal format and starts tracking performance using real-time exchange data. No more copying and pasting signal details or trying to remember exact entry times.
What really impressed me was how it handles different signal formats automatically. Every group has their own way of structuring signals – some use emojis, others use specific abbreviations, and many have unique formatting styles. SignalManager recognizes most formats immediately, and when it encounters a new one, it gets added to their database pretty quickly.
The multi-group analysis features have been game-changing for portfolio management. I can compare performance across different signal providers side-by-side, identify which groups perform better during specific market conditions, and spot correlation patterns between different providers. This kind of comparative analysis just wasn’t possible with my previous tools.
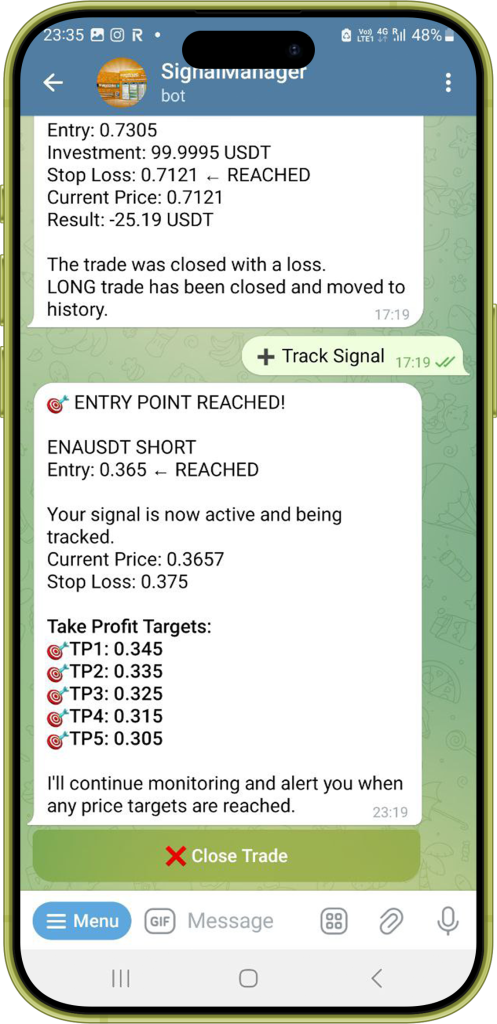
Real-time notifications keep me informed about signal progress without constantly monitoring charts. When targets get hit or stop losses trigger, I get instant alerts with all the relevant performance data. This lets me focus on other activities while staying informed about signal outcomes.
Setting up automated notifications for target hits and stop losses
Automated notifications solved one of my biggest frustrations with signal tracking – missing important developments because I couldn’t monitor charts 24/7. Crypto markets never sleep, but I definitely need to, so having reliable alerts became essential for comprehensive analysis.
The notification system I use now tracks multiple trigger points for each signal. Not just final outcomes, but intermediate targets, stop loss approaches, and unusual price action around entry levels. This granular alerting helps me understand signal progression, not just final results.
I’ve configured different notification types based on urgency and importance. Stop loss hits get immediate alerts since they represent capital risk, while first target achievements get standard notifications. Major market events that might affect open signals trigger priority alerts.
The timing of notifications matters more than I initially realized. Getting alerted when targets are hit helps me understand market momentum and whether signals are benefiting from broader trends or isolated price action. This context is crucial for evaluating signal provider skill versus market luck.
Mobile notifications have been particularly valuable for maintaining analysis consistency. Even when I’m away from my computer, I can track signal progress and make notes about market conditions. This ensures my tracking data remains complete regardless of my schedule.
Browser extensions and manual entry options for restricted groups
Some signal groups disable forwarding and copying, which initially seemed like it would break my tracking workflow. Fortunately, there are workarounds that maintain analysis quality while respecting group restrictions.
Browser extensions that can capture text from restricted channels have been helpful for maintaining comprehensive tracking. These tools can copy signal details even when normal forwarding is disabled, though you need to be careful about respecting group terms of service.
Manual entry features provide a backup option when automated methods aren’t possible. The process takes more time, but guided forms make data entry standardized and reduce the chance of missing critical signal components. I use this approach for a few premium groups that have strict sharing restrictions.
The key with manual entry is maintaining consistency in how you record signal details. Using standardized forms or templates ensures that manually entered signals integrate properly with automatically tracked ones for comparative analysis.
I’ve found that even restricted groups often allow screenshot sharing, which can serve as backup documentation for manual entry verification. This helps maintain tracking accuracy when you can’t capture signals automatically.
Spreadsheet alternatives and their limitations
After struggling with Excel for months, I tried several alternative approaches before finding tools that actually worked for comprehensive signal analysis. Each option has trade-offs worth understanding before committing significant time to any tracking method.
Google Sheets offers better collaboration features than Excel, which is useful if you’re sharing analysis with trading partners. The real-time sync helps prevent data loss, and built-in charting makes performance visualization easier. But it still requires manual data entry and doesn’t connect to real-time market data.
Specialized trading journals work well for personal trade tracking but often lack features needed for signal group analysis. They’re designed for tracking your own trades, not evaluating external signal providers across multiple timeframes and market conditions.
Some traders use crypto portfolio tracking apps, but these typically focus on holdings rather than signal performance. They miss crucial metrics like signal timing, execution difficulty, and provider-specific analytics that matter for choosing which groups to follow.
The fundamental limitation of any manual approach is time lag and human error. By the time you’ve updated spreadsheets with signal outcomes, market conditions have changed and new signals might be available. Professional tools eliminate this lag and provide real-time analysis capabilities.
Database solutions like Airtable offer more flexibility than basic spreadsheets, but setting them up properly requires significant technical knowledge. Unless you’re comfortable with database design, the learning curve might not be worth it compared to purpose-built signal tracking platforms.
The bottom line is that tracking tools should save you time and improve analysis quality, not become a project in themselves. I wasted months trying to perfect DIY solutions when dedicated platforms would have provided better results with less effort. My progression from spreadsheets to Cornix to SignalManager taught me that using the right tool for each specific job makes all the difference in signal analysis success.
Learning and Practice Strategies
I wish I’d understood the learning potential of signal tracking before I started throwing real money at every signal group I joined. My first approach was basically “see signal, copy trade, hope for profit” – which worked about as well as you’d expect. It wasn’t until I started treating signal analysis as an educational tool that I began understanding why some signals work and others don’t. This shift in mindset probably saved me thousands in losses and definitely made me a better trader overall.
Using signal tracking as a risk-free learning tool
The best decision I made early in my signal group journey was setting up tracking without risking actual capital. Instead of jumping straight into following signals with real money, I spent three months just observing and documenting outcomes. This approach taught me more about crypto markets than any course or YouTube video ever did.
Signal tracking lets you see market dynamics in real-time without the emotional pressure of having money on the line. You can watch how different assets react to similar technical setups, observe how news events affect signal outcomes, and understand the timing patterns that separate successful signals from failed ones.
I started noticing patterns I never would have caught while stressed about actual positions. Like how certain signal providers consistently posted calls right before major resistance levels, or how some groups had amazing win rates during low-volatility periods but struggled when markets got choppy.
The educational value extends beyond just signal evaluation. You’re essentially getting a masterclass in market behavior by observing hundreds of trade setups across different market conditions. I learned more about support and resistance levels, volume analysis, and price action patterns through signal tracking than through months of trying to analyze charts on my own.
What’s particularly valuable is seeing the same providers handle both winning and losing streaks. You start understanding the difference between systematic approaches and emotional trading. Some groups maintain consistent position sizing and risk management regardless of recent performance, while others start revenge trading after losses or get overconfident after wins.
Understanding market patterns through historical signal data
After tracking signals for several months, I had accumulated enough data to start identifying broader market patterns that weren’t obvious from individual trades. This historical perspective became incredibly valuable for understanding when signal strategies work best and when to be more cautious.
I discovered that certain signal types perform dramatically better during specific market phases. Breakout signals that work beautifully during trending markets often fail miserably during sideways action. Range-trading strategies that generate consistent profits during crab markets get destroyed when strong trends develop.
The timing patterns in historical data revealed insights about market structure I’d never considered. Some signal providers consistently post calls during the last hour of trading sessions, others focus on Asian market hours, and a few seem to have edge during major news events. Understanding these patterns helps explain performance variations.
Seasonal patterns started emerging from the data too. Certain months showed higher success rates for different signal types, probably related to institutional trading cycles, tax considerations, or just general market psychology during different times of year.
The most eye-opening discovery was how market volatility affects signal performance across the board. During high-volatility periods, even “good” signal providers see their win rates drop significantly, but their successful trades often have much larger gains. This helped me understand when to adjust position sizing and expectations.
Practicing risk management before committing real capital
Signal tracking provides the perfect laboratory for testing different risk management approaches without financial consequences. You can experiment with position sizing, stop loss placement, and portfolio allocation strategies using real market data and actual signal outcomes.
I used the tracking period to test different position sizing methods. What happens if you risk 1% per signal versus 2%? How does Kelly Criterion sizing compare to fixed percentage approaches? The historical signal data let me backtest these strategies across hundreds of trades without risking actual money.
Stop loss management became much clearer through signal analysis. I could see which signals got stopped out by normal market noise versus those that hit genuine reversal points. This helped me understand when signal providers’ recommended stop losses were too tight for typical crypto volatility.
Portfolio correlation was another crucial lesson from tracking multiple signal providers simultaneously. I discovered that many groups I thought were independent actually posted very similar signals during major market moves. This meant following multiple groups didn’t provide the diversification I expected.
The practice period also revealed my own psychological tendencies. Even without real money involved, I found myself getting excited about winning signals and frustrated by losers. This emotional response helped me understand what I’d need to work on before trading with actual capital.
Building confidence through paper trading signal analysis
Paper trading based on tracked signals bridges the gap between passive observation and real trading. You’re making actual trading decisions and experiencing the emotional aspects without financial risk. This practice phase was crucial for building confidence in both signal evaluation and execution skills.
I set up a virtual portfolio and started “trading” the signals I’d been tracking, using the same entry and exit criteria I’d use with real money. This revealed execution challenges I hadn’t considered during passive tracking – like how quickly you need to act on signals during volatile periods.
The paper trading phase exposed timing issues I’d missed during pure analysis. Some signals required immediate action to get decent fills, while others remained valid for hours. Understanding these execution requirements helped me identify which signal providers matched my availability and trading style.
Decision-making under pressure became much clearer during paper trading. When you’re actively choosing which signals to follow and managing multiple virtual positions, you start understanding the mental workload involved in following signal groups effectively.
The confidence building aspect was gradual but significant. After successfully managing paper trades for several months, including navigating some major market downturns, I felt much more prepared to transition to real capital. The practice period eliminated a lot of the uncertainty and fear that had caused poor decisions during my earlier signal following attempts.
Preparing for potential automated trading decisions
As I became more comfortable with signal analysis and paper trading, I started considering automated execution. The learning phase had given me enough data to identify which signal providers I trusted and understand the parameters needed for automated systems.
Signal tracking data provides the foundation for setting up automation parameters. You need historical performance data to establish appropriate position sizes, understand typical signal frequency, and set risk limits that align with each provider’s trading style.
The practice period helped me identify which signals were suitable for automation versus those requiring manual judgment. Some providers post clear, unambiguous signals perfect for automated execution, while others include contextual information that requires human interpretation.
Risk management for automated systems became much clearer after extensive tracking and paper trading. I understood the maximum drawdown periods I could expect, the typical duration of losing streaks, and the position sizing needed to survive normal market volatility.
Testing automation logic during the paper trading phase revealed potential issues before committing real capital. Things like how the system should handle partial fills, what to do when stop losses gap significantly, and how to manage signals posted during low-liquidity periods.
The transition from manual analysis to automated execution felt natural after months of systematic tracking and practice. I had confidence in the signal providers I’d chosen, understood their typical performance patterns, and had tested my automation parameters extensively with historical data.
The Learning Journey Never Ends
What surprised me most about using signal tracking as a learning tool was how much it improved my overall trading skills, even beyond just following signals. Understanding market patterns, risk management, and execution timing made me a better independent trader too.
The systematic approach to signal analysis taught me to evaluate any trading strategy more objectively. Whether it’s signals from groups or my own trading ideas, I now have the tools and mindset to test approaches thoroughly before committing significant capital.
Most importantly, the learning phase helped me develop realistic expectations about signal following. It’s not a get-rich-quick scheme, but when approached systematically with proper risk management, it can be a valuable component of a broader trading strategy.
Conclusion
Analyzing Telegram signal groups doesn’t have to be rocket science, but it does require patience, discipline, and the right analytical framework. Remember, there’s no magic formula for guaranteed profits – anyone promising otherwise is likely trying to separate you from your money!
The key is approaching each group with healthy skepticism while giving legitimate providers a fair chance to prove their worth. Use the metrics we’ve discussed, watch for those red flags, and always prioritize groups that educate rather than just dictate.
Start small with free tracking options, document everything systematically, and never risk more than you can afford to lose. Tools like SignalManager can automate much of the heavy lifting, letting you focus on analysis rather than manual data entry.
Ready to put these analysis techniques into practice? Start with tracking just 3 signals to get familiar with the process, then scale up as you build confidence in your analytical abilities!
Related Articles


Leave a Comment